
ALI ALMOSSAWI
I wrote An Illustrated Book of Bad Arguments, An Illustrated Book of Loaded Language, Bad Choices, and The Point of Pointless Work. My books have reached 3.5 million readers, have been translated into 23 languages, and have sold over 350,000 copies in print. I'm an alumnus of MIT and Carnegie Mellon. In my other career, I led an engineering and design team at Apple and most recently worked on Apple Vision Pro where I was a pillar lead for Siri. My biographical statement is at the bottom of this page.
I'm reachable at ali@almossawi.com
For inquiries about Bad Choices, please contact Seth Fishman at The Gernert Company.
For inquiries about the print editions of Bad Arguments or Loaded Language, please contact Karen Giangreco at Experiment Books.
The Critical Thinker Newsletter
Practical ideas every other Thursday to help you become a better critical thinker. Covers logical fallacies, cognitive biases, language, and images. Launched in June 2023. Subscribe now.

An Illustrated Book of Loaded Language
Learn to hear what's left unsaid in the subtle ways news headlines and various other forms of language influence our thinking. Out in print in November 2021. Order the print edition.

An Illustrated Book of Bad Arguments
A book on critical thinking that explains a set of common errors in reasoning, described by Hope Jahren as “a book every scientist should have.” Read it online or in print!
Bad Choices
An illustrated introduction to computational thinking, described by Vint Cerf as “one of the more clever ways of introducing computational thinking to the general public.” Take a look.

Hans in the Land of Bards
The opening part of a novella about an absentminded tailor and his quick-witted accomplice struggle to escape a land where things aren't always what they seem. Take a look.

The Point of Pointless Work
A reflection on five years in publishing, and the transformative power of hobbies. A book I wrote for my mailing list, published by Cormorant Press. Take a look.

Amaranta
A picture book for grown-ups that explores separation anxiety and empathy. Still a work in progress. Take a look.

Firefox Hardware Report
The first ever public report of the hardware used by Firefox users. The report's data can be used by developers to improve the experience of Web users. Take a look.

MetricsGraphics.js
A D3-based library that's optimized for visualizing and laying out time-series data in a principled way—600,000 hits, 7,100 GitHub stars, top 1% of most-starred projects. Take a look.

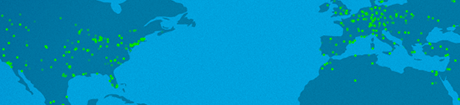
The Web We Want: Firefox 29
A real-time visualization of the global community that powers Mozilla, visited by 10 million visitors. My contributions were designing and coding the map and stats page. Take a look.
Pantheon
A project by the Macro Connections group at the Media Lab that I had the good fortune of co-developing. Pantheon visualizes global culture using cultural icons of note. Take a look.

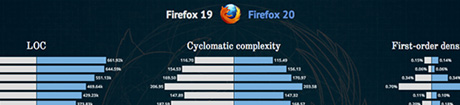
How Maintainable is Firefox?
By appealing to the explanatory powers of five practical measures of architectural complexity, this work explores the quality of the Firefox codebase. Take a look.

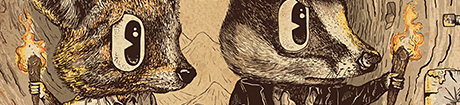
Technical Debt in Firefox and Chromium
A quantitative comparison of two complex software systems, using prose and a visual inspired by a story from Greek mythology. Take a look.
How Educated are World Leaders?
A descriptive visualization of the education levels of world leaders, from 1950 or thereabouts to the present day. Take a look.

Evolution of the Firefox Codebase
A visualization that presents a set of metrics for all releases of Firefox that are indicative of quality and allows one to inspect them through one of several views. Take a look.
Smaller works and experiments
- Plain English: A Cheat Sheet of Things to Be Wary Of
- The Big Five US Trade Book Publishers and Their Imprints
- Which Universities Did Popular British Comedians Go To?
- Visualizing in VR using A‑Frame and D3
- Browser Usage as Planets
- Classroom Seating Habits
Publications
- An Illustrated Book of Loaded Language (North America), published by Experiment Books
- The Point of Pointless Work, published by Cormorant Press
- Bad Choices (North America), published by Viking
- Bad Choices (UK and Commonwealth), published by John Murray
- Don’t Just Teach Kids How to Code, Teach Them Algorithms, Too; Bright
- How Algorithmic Thinking Can Help You Think Smarter, Change This
- Logic: In the Direction of Truth, Imagine Magazine—The Johns Hopkins Center for Talented Youth
- An Illustrated Book of Bad Arguments (North America), published by The Experiment, distributed by Workman
- An Illustrated Book of Bad Arguments (UK and Commonwealth), published by Scribe Publications, distributed by Penguin Books and Macmillan
- Book chapter: Visualizing ambiguity in an era of data abundance and very large engineering systems, New Challenges for Data Design, edited by David Bihanic, published by Springer-Verlag (London)
- The Data Visualization Revolution, co-authored with Cesar Hidalgo, Scientific American
- Going Beyond the One-Bit Democracy, co-authored with Cesar Hidalgo, Wired (UK)
- Analysis Tool Evaluation: Coverity Prevent, co-authored with Kelvin Lim and Tanmay Sinha, Carnegie Mellon
- MetricsGraphics.js - a lightweight graphics library built on D3, Mozilla Hacks
Interviews and talks
- Podcast: Thinking in Algorithms: My Conversation with Ali Almossawi [The Knowledge Project Ep. #38]
- Podcast: The Importance of Discipline; CEO Journals with Ethan Bridge
- Podcast: Arguments, Bad Arguments, and side projects; Young and Profiting
- Hidden gems do exist, meet Ali Almossawi, a Bahraini engineer working at Apple, author, and publisher; Startup MGZN
- Podcast: Using Algorithms to Make Better Decisions, Sidestepping Logical Fallacies and How To Think More Critically; Metalearn
- Video: This Week in Tech
- How to Use Algorithms to Solve Everyday Problems, MIT Sloan
- Video: D3 in Practice, SFHTML5 Meetup, Google, San Francisco (Slides)
- Video: Open-Sourcing the Creative Process, SDM Systems Thinking Series
- Informing with Design, Greylock Partners Design Group
- Audio: A conversation with ABC Radio about critical thinking and the art of making sense
- Ali Almossawi: Technical, Entrepreneurial, and Creative Mojo; MIT
- Talk at Links 2013 (MIT Media Lab) on measuring quality in complex software systems
- Video: Hosting guest speaker Cesar Hidalgo at Mozilla's Mountain View office
An Illustrated Book of Bad Arguments in the press
- This Short Book Makes You Smarter Than 99 Percent of the Population, Inc.com
- How to be a human lie detector of fake news, according to the latest science, CNN.com
- Why smart people believe coronavirus myths, BBC.com
- Summer Reading For The College-Bound, NPR
- A Finnish article on teaching children about logical arguments, yle.fi
- In the Mailbag: BEA 2015 Edition, Book Riot
- Eight Cousins Pick of the Year 2014
- San Diego Book Review
- Hones Of Contention, The Common Reader
- A Fun Primer on How to Strengthen, Not Weaken, Your Arguments; Open Culture
- Now More Than Ever, You Need This Illustrated Guide To Bad Arguments, Faulty Logic, And Silly Rhetoric; Fast Company
- Teach Your Kids Logic With An Illustrated Book of Bad Arguments by Jenny Williams, GeekDad
- 9 Charming Cartoons Explaining Logical Fallacies, BuzzFeed
- Bad arguments, great illustrations by Cory Doctorow at Boing Boing
- This Little Piggy Made A Logical Error, The Dish
- A guide to fallacious arguments, illustrated with funny animals; io9
- National Indie Bestsellers - Extended Hardcover Nonfiction
- Southern Indie Bestseller List
- Book review: 'Bad Arguments' will entertain, help you diagnose poor logic; Omaha.com
- Book review: Tripping Over Logic, The Philosophy Club
- The Lost Art of Making Sense, ABC Radio
- New hardcover books teach kids through superheroes, gaming, art; Denver Post
- Greenville Public Library review
- How to argue, with others and yourself; Andreessen Horowitz Weekend Newsletter
- Shelf Awareness starred review
- Appearance in Page Turners, submitted by Ellen at The Griswold Inn Store
Bad Choices in the press
- This Week in Tech
- Review in New Scientist, From statistics to surgery to psychology: Our favourite reads
- Bad Choices: How Algorithms Can Help, Slice of MIT
- Bad Choices to John Murray
- Web guru signs for John Murray
An Illustrated Book of Loaded Language in the press
- Review on GeekMom.com by Jenny Bristol
- How to Recognize the Weasley, Smarmy, and Otherwise Loaded Language That People Use Against You; Lifehacker
Mentions and various other things
- Managing and visualizing big data by Meredith Somers, MIT Sloan
- Finally, a Handy Chart of the Big Five Book Publishers and Their Imprints; Tor
- Mozilla Firefox Hardware Report, SD Times
- Most Firefox users are running Windows 7 on dated PCs, Engadget
- Do-Not-Track Talks Could Be Running Off the Rails by Natasha Singer, New York Times
- What The World Wants From The Future Web As The FCC Looks To Shut The Door On Net Neutrality
- Evidence-based Software Engineering
- MIT $100K 2012 semi-finalist
- Weather doesn't affect ice cream consumption, Harvard Gazette
- Stewart Lee . . . has let himself go
- Interview with Behance CEO Scott Belsky
Personal writings
- A Wisp of Smoke
- Identity
- Measuring Code Quality (or What Does the Fox Weigh?)
- Five Ideas for Achieving Clarity in Data Visualization
- Open-Sourcing the Creative Process
- A Beautiful Night
- Shorty by Mikhail Naima, translated into English
- Randy Pausch's Last Lecture, translated into Arabic
Brief biographical statement Ali Almossawi is the bestselling author of An Illustrated Book of Bad Arguments, An Illustrated Book of Loaded Language, Bad Choices, and The Point of Pointless Work. His books have reached 3.5 million readers, translated into 23 languages, and have sold over 350,000 copies in print. He is an alumnus of MIT and Carnegie Mellon. In his other career, he leads an engineering and design team at Apple.
Download headshot 1, or headshot 2 (no copyright, public domain).